CBSE Class 8 Maths Some Common Linear Graphs
- What is a line graph ? What are the types of line grapes?
- A bank gives 10% simple interest on the deposits. Draw a graph to show the relation between the sum deposited and the simple interest earned.
- The following table shows the relation between side and the perimeter of a square. Side (in cm) 2 4 6 8 10 Perimeter (in cm) 8 16 24 32 40 Represent this table in the form of a graph.
- A metal piece is heated and its temperature is noted at different intervals and recorded in a tabular form. Time (in sec.) 2 6 10 14 Temperature (in oC) 19 27 35 43 Represent this table in the form of a graph.
- Plot the graph for the following table and check whether it is a linear graph or not. X 3 5 7 9 y 12 20 40 36
- Using a convenient scale plot the points for the multiples of 3.
- Two quantities x and y are related by the relation y = 5x + 3. Make a point table for 4 different values of x.
-
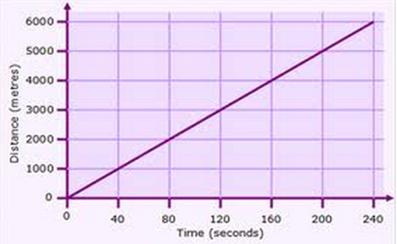
The following graph shows the relation between time and distance.
 Study the graph and answer the following questions.
(a) Find the distance covered in 80 seconds.
(b) The distance 5000 m is covered in what time?
- Following table shows the relation between number of balls and their cost. Number of balls 5 10 20 Cost (in Rs) 15 30 60 Draw the graph for above data and hence find the cost of 15 balls.
- Following table shows the relation between number of books sold and the profit earned on it. Number of books sold 3 6 15 Profit earned (in Rs) 15 30 75 Draw the graph for above data and find the profit earned if 12 books are sold.


